Here we are again, another massive SPY 0.00%↑ rally - nothing new however, the markets ebb and flow and the longer I do this the more it just becomes like a video game (at least with momentum style trading).
$5000 is a key Fibonacci extension and just above that $5140 is a spot as well on a measured move. You can add on other indicators to the analysis, and I am certain you’ll get the same exhausting signals pointing to caution, but this is one that I use and that I have used since 2009 and it’s rarely wrong. Some of you read that as “I should sell everything” and some of you read it as I would suggest as a tool for sentiment to give you a read on where it’s short-term risk on/off.
But as Ma$e said “I do what works for me, you do what works for you”
So why do I care about this? I care because what the indices do leads to the overall sentiment to the rest of the market because we’re all invested in the S&P and Nasdaq. If I think the indices are in areas of reversal or exhaustion that changes how I approach: A) Risk on day trades long B) new long trades - you should be able to put those two together. Your stock or the market you trade IS NOT AN ISLAND it will be affected by overall market risk-off and a failure to accept that is deadly.
Powell speaks on 60 minutes tonight so let’s see what he has to say. We also have the 30 and 10 year auctions this week to watch. We can sit here and discuss whether he is going to cut or not (like every other blog) but the fact as I see it is this:
a) If you’re day trading a portfolio that doesn’t mater
b) Unless you’re a long-term investor that also doesn’t matter
I have an opinion on whether he does or not and I care because there are stocks that I have researched that I’d like to own via LEAPs and the equity for my LPs - as core holds based off a cyclical change. However, there’s no point in talking that much on this blog anymore because most are not investors for the long term.
In the equity markets we are past the major earnings and really, I could care less about most of them.
What AAPL 0.00%↑ does what GOOGL 0.00%↑ does or what META 0.00%↑ does just doesn’t interest me aside from the fact that we use them in The Momentum Monitor as tools for day-trading momentum: nothing more.
There are other names in the report that I do care about like some new shorts in housing and some longs in retailers - those are names that have upside/downside and where the average market patrician does not look. One of those names his HIMS 0.00%↑ which I am going to add into with LEAPS this week.
S&P Futures: If we get below $4920 then $4870 is back in play - that’s where the line in the sand was held last week.
I made a separate video in this week’s outlook explaining why using market timing on the S&P500 is important for a few reasons so be sure to watch that.
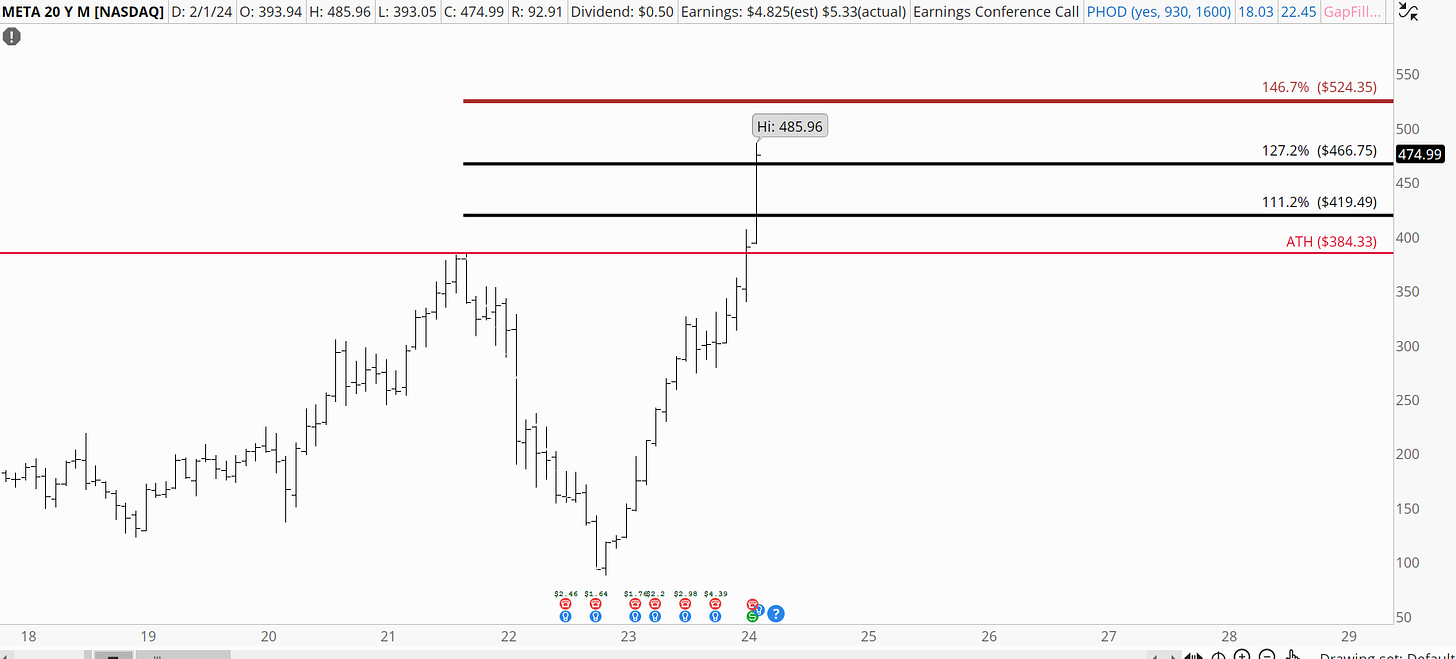
META: Unreal last week for a lot of reasons but that $50B share buyback is phenomenal - however, chasing it here for me is not the play and I assume the average investor will pile in to it so this creates a situation for day trade reversal shorts this week. $460 then $420 are downside areas from high time frame levels I am watching, and we have a Fib extension at 146.7 to watch.
Again, just like the S&P high time frame signals this has it as well - that has always helped as a guide a long with macro analysis as well.
Top-Down Analysis is usually this style (except we use technicals in it)
Whereas bottoms up analysis (like VSCO 0.00%↑ long) there is little to no technical analysis.
Read the differences between top down and bottoms up here.
So, like I explained above the S&P analysis matters to names that are used for shorter-term trading NOT VALUE INVESTING.
This week the outlook is a little longer so I can dive into more of an explanation of my analysis process when it comes to short-term trading (1day to 8 weeks) and explain how that drives size of a trade and the trade idea generation.
The Weekly Market Outlook Inside Includes:
The LongVol Report Outlook
9 Minute Video on S&P Top Down Analysis
The Regular Market Oulook Video
3 Short Ideas to Watch
Keep reading with a 7-day free trial
Subscribe to The LongVol Report to keep reading this post and get 7 days of free access to the full post archives.


